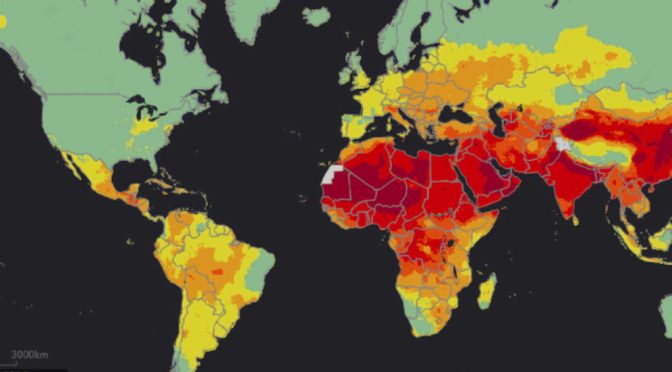
Nearly all of the world’ population is living in places with dangerous air pollution levels, the World Health Organization (WHO) air quality model confirms.
While we tend to believe that our cities are safe from pollution, the truth is that 3 million deaths a year result from outdoor air pollution.
Indoor air pollution doubles the number, as the data from 2012 shows that indoor and outdoor air pollution was responsible for 6.5 million deaths, making up 11.6% of all global deaths.
Dr Flavia Bustreo, Assistant Director General at WHO, said:
“The new WHO model shows countries where the air pollution danger spots are, and provides a baseline for monitoring progress in combating it.”
The model is the most detailed of its kind reported by the WHO based on health data from satellite measurements, air transport models and ground station monitors in 3000 urban and rural locations.
Overall, 94% of deaths are due to stroke and heart related diseases, lung cancer and chronic obstructive pulmonary disease.
In addition, acute respiratory infections risk increases with air pollution.
About 90% of air pollution related deaths are in middle and low income countries with 2 out of 3 occurring in Western Pacific regions and South-East Asia.
The main causes for air pollution include household fuel and waste burning, inefficient modes of transport, industrial activities and coal-fired power plants.
Not all air pollution is caused by human activity, though, as nature is involved as well, for example, dust storms can affect air quality.
Dr Bustreo said:
“Air pollution continues take a toll on the health of the most vulnerable populations — women, children and the older adults.
For people to be healthy, they must breathe clean air from their first breath to their last.”
Dr Maria Neira, director of the WHO’s Department of Public Health, Environmental and Social Determinants of Health, said:
“Fast action to tackle air pollution can’t come soon enough.
Solutions exist with sustainable transport in cities, solid waste management, access to clean household fuels and cook-stoves, as well as renewable energies and industrial emissions reductions.”
Further information: Ambient air pollution: A global assessment of exposure and burden of disease
This WHO heat map shows the highest (red) and lowest (green) levels of air pollution worldwide.
Credit: Image courtesy of World Health Organization
